Introduction
When budget season arrives, HR and people leaders face a familiar challenge: "employees feel appreciated" doesn't hold up in a CFO conversation—ROI data does. Recognition programs drive engagement and retention, but without measurement frameworks, organizations risk program cuts, missed optimization opportunities, and wasted spend. According to Gallup's State of the Global Workplace Report, lost productivity from low engagement costs the global economy $438 billion annually.
This guide gives you a practical framework for measuring recognition platform ROI. You'll learn which metrics to track—turnover cost savings, engagement score shifts, productivity gains—how to collect and interpret the data, and how to build a results presentation that lands with finance and leadership.
Key Takeaways
- Recognition ROI spans three categories: People Metrics, Business Impact, and Program Efficiency
- Establish baselines for turnover rate, engagement scores, absenteeism, and rewards spend before launch
- The core ROI formula is: (Total Benefits Gained – Total Program Cost) ÷ Total Program Cost × 100
- ROI compounds over 12–18 months—measuring too early or focusing only on usage metrics skews results
- Built-in analytics surface real-time recognition data and engagement trends, making measurement far easier
What to Set Up Before You Start Measuring
Measuring ROI without baseline data is like checking progress without a starting point. You'll have engagement scores and turnover data post-launch but no way to attribute change.
Baseline benchmarking captures your organization's current state across key metrics before implementing your recognition platform. Collect these five metrics before go-live:
- Voluntary turnover rate — Calculate the percentage of employees who left voluntarily over the past 12 months
- Employee engagement score — Pull existing survey data or eNPS (Employee Net Promoter Score) results
- Absenteeism rate — Track average unplanned absences per employee per month
- Recognition-related rewards spend — Document department-level spending on gifts, cards, awards, and informal recognition
- Productivity or performance data — Record available metrics like sales per employee, customer satisfaction scores, or output per hour
Identify Your Primary ROI Objectives
Not every organization needs to measure everything. Prioritize based on where the pain is.
If turnover is the crisis, focus on retention metrics. If productivity is flat, track output and absenteeism. If engagement scores are declining, emphasize survey results and participation rates.
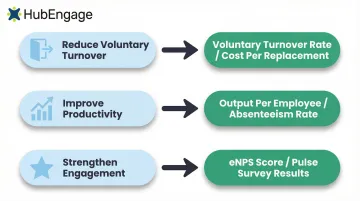
Tie each objective to 1–2 measurable KPIs:
- Objective: Reduce voluntary turnover → KPI: Voluntary turnover rate, cost per replacement
- Objective: Improve productivity → KPI: Output per employee, absenteeism rate
- Objective: Strengthen engagement → KPI: eNPS score, pulse survey results
Assign Measurement Ownership
ROI measurement fails when it's nobody's job. Assign a specific owner (an HR analyst, engagement lead, or platform admin) responsible for pulling data quarterly and maintaining a running ROI dashboard.
Platforms like HubEngage offer built-in reporting dashboards that reduce manual tracking effort, making it easier to assign this responsibility without adding headcount.
Key Metrics That Define Employee Recognition ROI
Recognition ROI is not a single number—it's a composite of several measurable outcomes organized into three categories: People Metrics, Business Impact Metrics, and Program Efficiency Metrics.
People Metrics: Retention and Engagement
Voluntary turnover rate is the most financially significant people metric. Research from Gallup shows the cost of replacing an individual employee ranges from one-half to two times the employee's annual salary. For leaders and managers, replacement costs reach 200% of salary; for technical professionals, 80%; and for frontline employees, 40%.
Calculate the dollar value of turnover reduction: (Baseline Turnover Rate – Post-Program Turnover Rate) × Average Replacement Cost
For example, if your baseline turnover is 20% among 100 employees with an average replacement cost of $50,000, and your program reduces turnover to 15%, you've saved: (20% - 15%) × 100 employees × $50,000 = $250,000
Employee engagement scores from pulse surveys and annual surveys serve as leading indicators of retention and performance. Gallup and Workhuman research found that well-recognized employees were 45% less likely to have changed organizations two years later.
Business Impact Metrics: Productivity and Customer Satisfaction
Recognized employees deliver measurable output improvements. Research by Bersin & Associates found that in organizations where recognition occurs, employee engagement, productivity, and customer service are about 14% better than in those where recognition does not occur.
Track productivity through:
- Output per employee (sales, units produced, projects completed)
- Revenue per employee
- Quality metrics (error rates, rework percentages)
Customer satisfaction scores (NPS/CSAT) represent downstream metrics—recognized, engaged employees deliver better customer experiences. Track eNPS (employee Net Promoter Score) alongside customer NPS to identify correlation. Harvard Business Review research showed that stores moving from bottom quartile to top quartile in employee experience metrics increased revenue by more than 50%.
Program Efficiency Metrics: Cost Savings and Admin Time
Switching to a consolidated recognition platform often reduces rewards spend that was previously fragmented across departments. WorkTango data puts average savings at 15-20% of existing rewards budgets after consolidation.
Admin time is the other half of the efficiency equation. Calculate it by multiplying hours saved per month by average HR hourly cost. Awardco case study data showed one organization saved 296 hours annually, a 93% decrease in administration time.
Gamification and Participation Data as ROI Signals
Those efficiency gains only hold if employees actually use the platform. That's where participation data becomes critical: it functions as a leading indicator of program health before issues show up in retention or productivity numbers. Monitor:
- Leaderboard activity and rankings
- Badge redemption rates
- Peer recognition frequency and manager-to-employee recognition ratios
- Participation rates across channels (mobile, web, SMS, email)
Low participation rates signal ROI at risk; high participation indicates strong program adoption. Platforms like HubEngage expose these metrics directly in the dashboard, so HR teams can spot disengagement early and adjust before it affects retention or productivity.
How to Measure Recognition ROI: A Step-by-Step Process
Measuring ROI requires a structured process, not a one-time audit. These five steps create a repeatable measurement cycle.
Step 1 – Establish Your Baseline and Set Measurable Goals
Pre-launch data collection is non-negotiable. Map each goal to a specific KPI with a defined target and timeframe.
Good goal: "Reduce voluntary turnover by 15% within 12 months" Bad goal: "Improve morale"
Document your baseline metrics and targets in a simple tracking document that includes the metric name, baseline value, target value, measurement frequency, and data source.
Step 2 – Implement Consistent Data Collection Touchpoints
Data should be collected at defined intervals:
- Platform analytics: Weekly or monthly (recognition frequency, participation rates, badge redemptions)
- Pulse survey results: Bi-weekly or monthly (eNPS, engagement scores)
- Retention/absenteeism data: Quarterly (voluntary turnover rate, unplanned absences)
- Full engagement survey: Annually (comprehensive engagement scores)
Build a simple tracking spreadsheet or dashboard with these intervals mapped out. Assign the measurement owner to pull data at each touchpoint and update the central dashboard.
Step 3 – Apply the ROI Formula and Monetize Benefits
The core ROI formula is: (Total Measurable Benefits – Total Program Cost) ÷ Total Program Cost × 100
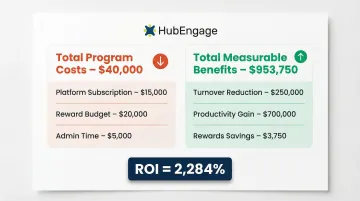
Worked Example: A 100-person organization implements a recognition platform:
Total Program Cost:
- Platform subscription: $15,000/year
- Reward budget: $20,000/year
- Admin time (setup + ongoing): $5,000/year
- Total Cost: $40,000
Total Measurable Benefits:
- Turnover reduction: 5 fewer departures × $50,000 replacement cost = $250,000
- Productivity gain: 14% improvement × $5M total compensation = $700,000
- Rewards consolidation savings: 15% × previous $25,000 spend = $3,750
- Total Benefits: $953,750
ROI Calculation: ($953,750 - $40,000) ÷ $40,000 × 100 = 2,284% ROI
Step 4 – Combine Quantitative Data with Qualitative Evidence
Hard metrics make the business case, but qualitative evidence is what makes it stick with leadership. Supplement your data with:
- Employee survey verbatims highlighting feeling valued
- Recognition story highlights showcasing culture change
- Manager feedback on team morale improvements
- Qualitative signals from pulse survey open-ended responses
Together, qualitative and quantitative data give you a complete picture — one that's harder to dismiss and easier to act on.
Step 5 – Report Results on a Defined Cadence and Iterate
ROI measurement should drive program improvement, not just fill executive slide decks. Establish a quarterly review cycle:
- Pull data and compare to baseline and targets
- Identify underperforming segments (departments, locations, employee types)
- Adjust recognition strategies based on insights
- Report to leadership with recommendations
The longer a recognition program runs, the stronger its compounding effect on retention, culture, and productivity. O.C. Tanner research shows 93% of clients see measurable ROI in the first year; HR Cloud data puts that figure at 300–500% ROI within 12–18 months for large enterprises.
How to Interpret Your ROI Data and Present It to Leadership
Distinguish between program metrics (participation rate, recognition frequency) and business outcome metrics (turnover reduction, productivity gains). Presenting only platform usage data to executives misses the business case. Leaders care about dollars saved and performance improved, not login rates.
Translate metrics into executive language:
- Retention improvement → Cost avoidance from prevented turnover
- Productivity gains → Revenue impact or cost savings from improved output
- Engagement score increases → Projected profitability impact tied to engagement tier
Gallup's Q12 Meta-Analysis found that comparing top-quartile with bottom-quartile engagement, business units achieved a 23% difference in profitability. Use this benchmark to project financial gains from engagement improvements.
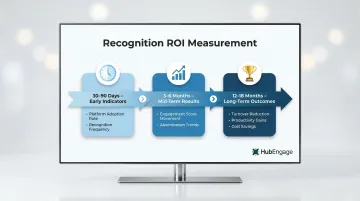
Understand the time horizon:
- 30-90 days: Early indicators (platform adoption, recognition frequency)
- 3-6 months: Mid-term results (engagement score movement, absenteeism trends)
- 12-18 months: Long-term outcomes (turnover reduction, productivity gains, cost savings)
Frame patience as strategic, not a sign of failure. When leadership understands the timeline upfront, they evaluate progress against the right milestones — not just the first 90 days.
Common Mistakes That Undermine Recognition ROI Measurement
Most measurement failures come down to three recurring patterns. Spotting them early saves you from drawing the wrong conclusions—or cutting a program that just needed more time.
Measuring Too Early
Recognition programs need at least 6–12 months to show meaningful impact on retention and engagement. Organizations that measure at 90 days and see flat numbers often shut programs down before they gain traction.
Set explicit measurement milestones in your program plan that align with realistic timeframes—30 days for participation baselines, 6 months for engagement shifts, 12 months for retention signals.
Tracking Only Vanity Metrics
Platform logins or badges issued don't equal business ROI. If recognition frequency is up but turnover is unchanged, the program likely has a structural problem—recognition not tied to values, or rewards that don't resonate with employees.
The fix is knowing which metrics to pair:
- Leading indicators: participation rates, recognition frequency, manager adoption
- Lagging outcomes: retention, absenteeism, productivity, eNPS scores
Failing to Account for All Program Costs
Incomplete cost accounting inflates apparent ROI. Include all costs:
- Platform subscription fees
- Reward budget and fulfillment costs
- Admin time for setup and ongoing management
- Communications overhead (announcements, training materials)
- Onboarding and training time for managers and employees
- Integration costs with existing HRIS or communication systems
Frequently Asked Questions
How to measure ROI on employee engagement?
Employee engagement ROI is measured by tracking changes in business outcomes (retention, productivity, absenteeism, customer satisfaction) before and after implementing engagement initiatives, then monetizing those improvements against program costs using the standard ROI formula. Focus on outcomes that tie directly to financial performance.
How to measure engagement and retention?
Engagement is typically measured through pulse surveys, eNPS scores, and platform participation rates. Retention is tracked via voluntary turnover rate over defined periods. Both should be measured against a pre-program baseline to isolate the impact of your recognition program.
Are engaged employees 23% more profitable?
Yes. Gallup's research confirms that top-quartile business units achieved 23% higher profit than bottom-quartile units. Engaged employees are more productive, more customer-focused, and less likely to leave — each factor compounding the financial advantage.
What is a good ROI for an employee recognition program?
A well-implemented recognition program typically delivers returns that significantly exceed platform costs. Even modest turnover reduction at a 100-person company can return multiples of the investment — research shows each $1 invested can generate $5–7 in return.
What metrics should I track before launching a recognition program?
Capture these baselines before launch:
- Voluntary turnover rate
- Employee engagement score (from existing surveys)
- Absenteeism rate
- Rewards/gifting spend across departments
- Available productivity or performance benchmarks
These metrics create the comparison framework you'll need to prove program impact.
How long does it take to see ROI from an employee recognition platform?
Early adoption signals (participation rates, recognition frequency) typically appear within 30–90 days, engagement score improvements within 3–6 months, and significant retention and productivity ROI within 12–18 months of sustained program operation. The longer the program runs consistently, the stronger the measurable returns.