Managing a modern workforce requires more than tracking headcount, attendance, and payroll. HR teams today have access to large volumes of workforce data covering recruitment, employee engagement, performance, retention, absenteeism, compensation, and other critical areas. The challenge is turning all that information into insights that support better decisions.
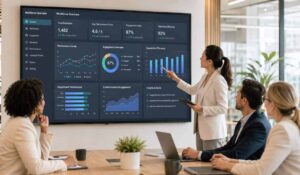
An HR analytics dashboard helps solve this problem by bringing important workforce management metrics together in one visual interface. Instead of reviewing disconnected spreadsheets or manually compiling reports, HR professionals and business leaders can quickly identify trends, monitor key performance indicators (KPIs), and make data-informed decisions.
Our guide explains what an HR analytics dashboard is, the metrics it should include, practical examples, and best practices to create dashboards that support the needs of a modern workforce.
Key Takeaways
- An HR analytics dashboard brings workforce data and HR KPIs together to support data-driven decisions.
- Key HR metrics include headcount, turnover, retention, absenteeism, hiring, engagement, training, and communication.
- HR dashboards improve workforce planning, reduce manual reporting, and help measure its ROI.
- Strong dashboards use clear visuals, data segmentation, integrations, role-based access, and secure employee data.
- Best practices include tracking business-focused KPIs, maintaining accurate data, and adding context to workforce trends.
- Employee experience platforms can add survey, recognition, communication, gamification, and feedback data to HR analytics dashboard.

What is an HR Analytics Dashboard?
A visual tool that displays important workforce metrics and key performance indicators (KPIs) in one place. It helps HR teams monitor workforce trends without manually reviewing multiple spreadsheets, reports, or systems. While a basic HR dashboard shows what is happening, HR analytics can help teams explore why a trend may be happening and where further action is needed.

Why are HR Analytics Dashboards important for modern workforce?
Modern workforces are more distributed than ever. An organization may have corporate employees, remote teams, hybrid workers, frontline employee engagement, and teams spread across multiple locations. This can make it difficult for HR leaders to maintain a consistent view of the workforce.
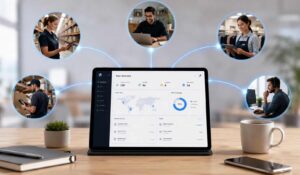
An HR analytics dashboard centralizes important HR data, making it easier to monitor changes and support timely decisions. For example, if employee turnover increases, HR can examine whether the change is concentrated within a particular location, department, role, or employee group. For frontline organizations, dashboards can also help compare workforce trends across stores, hospitals, factories, warehouses, branches, or field teams.
1. HR Analytics Dashboard Benefits
A well-designed HR analytics dashboard can create measurable business value by helping leaders connect workforce trends with organizational goals.
2. Faster Decision-Making
HR leaders can quickly access key workforce metrics, reducing time spent collecting data and helping them make faster, informed decisions.
3. Better Workforce Planning
Headcount, hiring, turnover, skills, and staffing data help organizations understand current needs and prepare for future workforce requirements.
4. Improved Employee Retention
Tracking retention, turnover, engagement, and feedback helps HR teams spot early workforce issues and take action to improve retention.
5. Greater Visibility Across Distributed Teams
A centralized HR dashboard helps organizations compare workforce metrics across departments, regions, branches, frontline teams, and other work locations.
6. Reduced Manual Reporting
Automated HR reporting reduces spreadsheet work, saves time, and lets HR teams focus more on analyzing data and taking action.
HR Analytics Dashboard Features
The right features make an HR dashboard easier to understand and use.
| HR Analytics Dashboard Feature | Why It Matters |
|---|---|
| Customizable dashboards | Focus on HR metrics and KPIs that match business goals. |
| Data visualization | Use charts, graphs, and scorecards to simplify workforce data. |
| Filters and segmentation | Compare HR data by location, department, role, or employee group. |
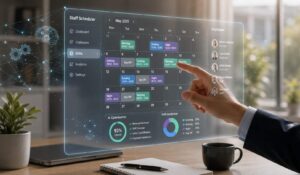
| Real-time or scheduled reporting | Keep HR teams updated on important workforce changes. |
| Role-based access | Give users access only to the HR data they need. |
| Integrations | Connect HR systems, surveys, and communication tools for richer workforce insights. |
| Export and reporting | Share HR analytics reports easily with managers and business leaders. |
HR Analytics Dashboard Examples
Different HR dashboard examples can be created for different business needs.
1. Executive HR Dashboard
Provides leadership with high-level metrics such as headcount, turnover, retention, engagement, and workforce costs.
2. Employee Engagement Dashboard
Tracks employee surveys, participation, communication engagement, recognition, feedback, and related trends.
3. Recruitment Dashboard
Monitors open positions, time to hire, cost per hire, candidate sources, and offer acceptance.
4. Retention Dashboard
Shows voluntary turnover, retention, tenure, and employee departures across teams or locations.
5. Frontline Workforce Dashboard
Tracks engagement, communication reach, participation, training, and other workforce metrics across stores, factories, healthcare facilities, or field teams.
6. Distributed Workforce Dashboard
Compares workforce trends across remote, hybrid, office, and geographically distributed teams.
HR Analytics KPIs to Track
The best HR analytics KPIs depend on business goals. Instead of tracking every available metric, organizations should prioritize indicators that support real decisions. Important HR KPIs can include:
| HR Analytics KPI | What It Measures |
|---|---|
| Employee headcount | Total employees and workforce growth over time. |
| Employee turnover rate | Percentage of employees who leave during a set period. |
| Retention rate | Percentage of employees who stay with the organization. |
| Absenteeism rate | Frequency or percentage of employee absences. |
| Time to hire | Time taken to move candidates through the hiring process. |
| Cost per hire | Average recruitment cost for each new employee. |
| Employee engagement | Employee sentiment, feedback, participation, and engagement levels. |
| Training completion | Percentage of assigned employee training completed. |
| Communication engagement | Reach, views, clicks, and interactions with internal communications. |
An HR analytics dashboard can also support HR return on investment (ROI) measurement. For example, if an organization introduces an employee engagement or training initiative, HR can compare its costs with relevant changes in retention, participation, productivity indicators, or other defined outcomes.
Not every HR outcome can or should be reduced to a financial number. Dashboards should combine ROI with employee experience and workforce metrics to help with how to measure employee satisfaction
HR Analytics Dashboard Best Practices
An effective dashboard should simplify decisions rather than add more data. Here are some best practices you can take up:
1. Start With Business Goals
Decide what questions the dashboard should answer before selecting metrics. If retention is the priority, focus on turnover, tenure, engagement, absenteeism, and related indicators.
2. Keep the Dashboard Simple
Avoid filling the screen with unnecessary charts. Highlight the metrics that matter most and provide detailed views when users need additional information.
3. Segment Workforce Data
Company-wide averages may hide important trends. Compare results by department, location, role, or other appropriate workforce segments.
4. Maintain Accurate Data
Regularly check for missing, duplicate, outdated, or incorrectly classified information. Consistent definitions are also important when calculating HR KPIs.
5. Protect Employee Data
Use role-based permissions, secure authentication, encryption, audit controls, and appropriate data governance. Sensitive information should only be accessible to authorized users.
6. Add Context
A number alone may not tell the full story. Compare current metrics with previous periods, targets, internal benchmarks, or other relevant measures.
Build an employee-driven HR Analytics Dashboard with HubEngage
Our employee experience platform brings employee communication, AI-powered surveys, recognition, and gamification into one connected system. Also it can easily connect with third party tools or even your current hr software so that these modules add up as important data streams for engagement metrics on your hr analytics dashboard.
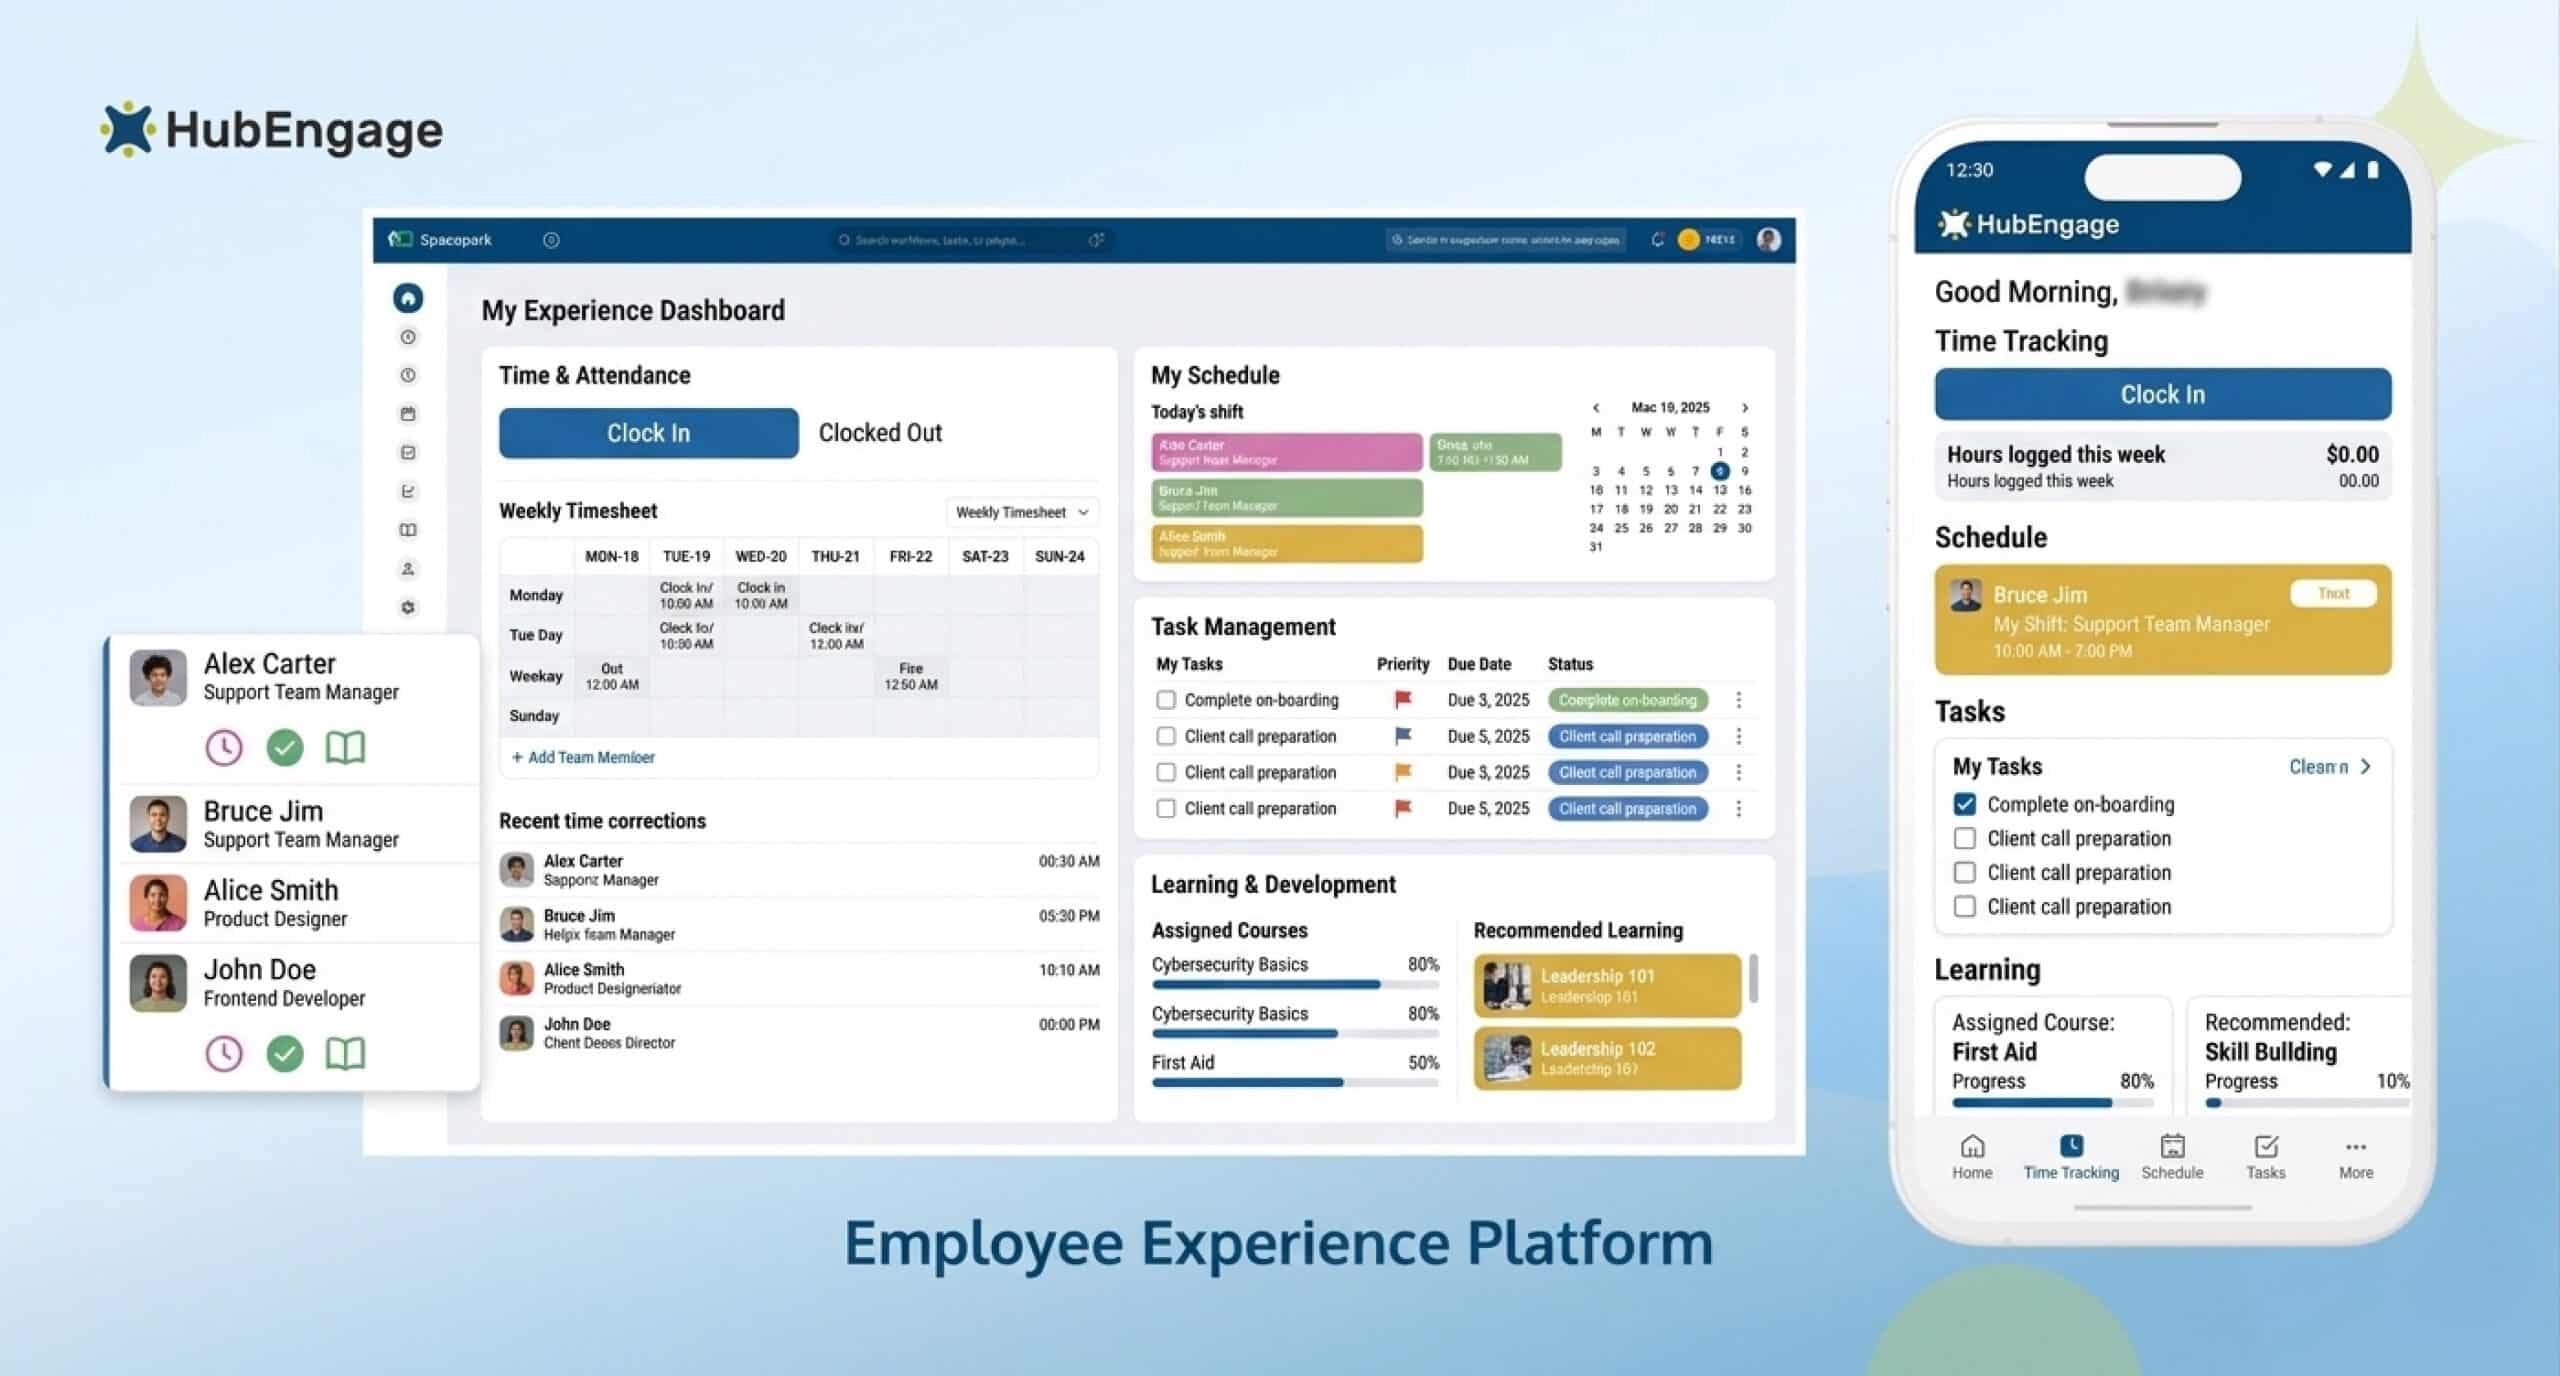
HR teams can measure communication reach, survey participation, employee feedback, recognition activity, and overall engagement across locations. By bringing these insights together, this workforce analytics platform helps organizations better understand employee needs, increase participation, improve workplace experiences, and connect employee engagement initiatives with your business goals.
Conclusion
An HR analytics dashboard helps modern organizations turn workforce data into clear, useful insights. By tracking the right KPIs, HR teams can improve workforce planning, understand engagement, monitor retention, support distributed teams, and make better people decisions.
The most effective dashboards stay simple, secure, relevant, and closely connected to business goals. To see how workforce insights can support a better employee experience, explore the HubEngage Employee Experience Platform and take a demo today for your modern workforce needs.
FAQs on HR Analytics Dashboard
How often should an HR dashboard be updated?
The frequency depends on the metrics and business requirements. Operational metrics may require daily or weekly updates, while strategic workforce metrics may be reviewed monthly or quarterly.
How can small businesses use an HR analytics dashboard?
Small businesses can use an HR analytics dashboard to track hiring, attendance, turnover, retention, and employee engagement. It provides a simple view of workforce trends without relying on multiple spreadsheets or manual HR reports.
How can AI improve an HR analytics dashboard?
AI can help HR analytics dashboards summarize workforce trends, identify unusual patterns, and make large datasets easier to explore. Human review remains important for interpreting results and making fair, context-aware workforce decisions.
What is the best HR analytics dashboard for a small business?
The best HR analytics dashboard for a small business is simple, easy to update, and focused on important workforce metrics. It should also help track progress toward business goals. HubEngage’s workforce experience platform offers a strong HR analytics dashboard for modern organizations by connecting with different tools.
What employee data should not appear on an HR dashboard?
Dashboards should avoid displaying unnecessary sensitive or personally identifiable information. Only data required for legitimate workforce decisions should appear, with sensitive information restricted, anonymized, aggregated, or masked whenever appropriate.
What compliance requirements should an HR analytics dashboard follow?
Compliance requirements depend on location, industry, and the employee data collected. Organizations may need to consider privacy, employment, record-retention, security, and data-protection requirements such as GDPR or applicable local privacy laws.
Related Links
workforce analytics platform | workforce management | enterprise integrations | how to measure employee satisfaction l frontline employee engagement